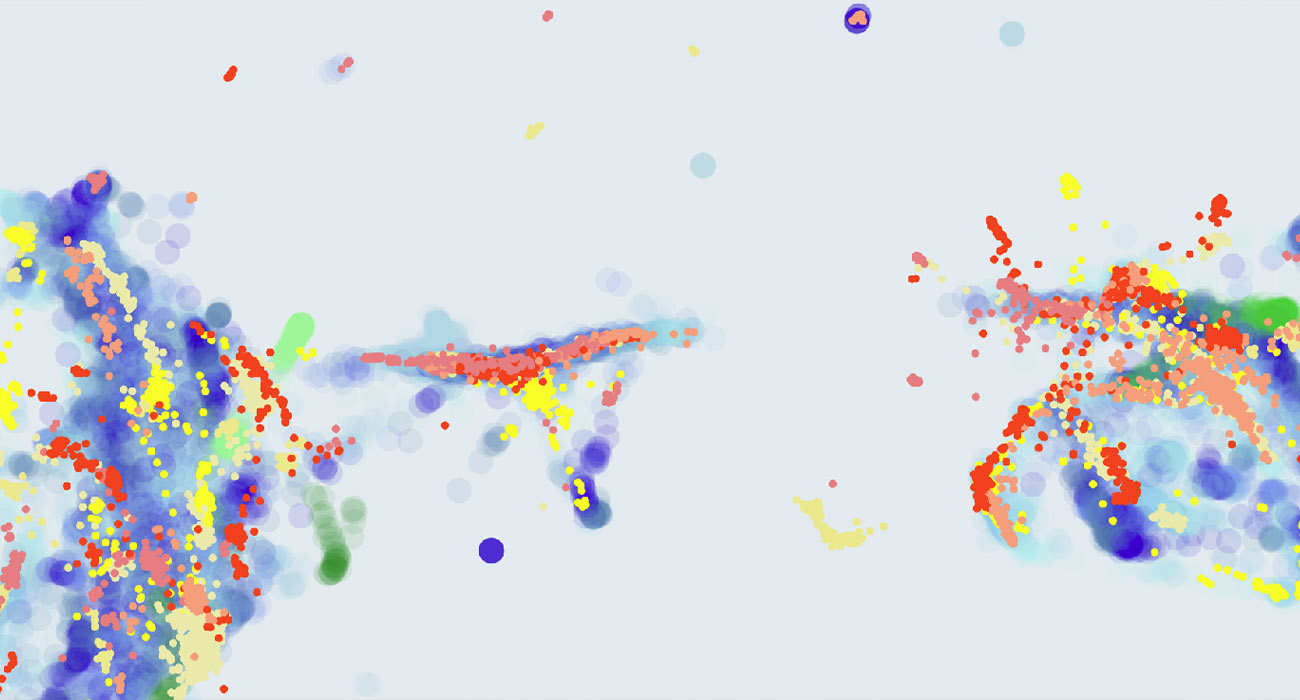
In this paper we explore the potential of qualitative, visual inspection to help understanding audio data for Unsupervised Anomaly Detection under Domain-Shift Conditions (UAD-S). In UAD-S, anomalous data is not known beforehand, and detectors must identify anomalies just from knowledge of non-anomalous (i.e. normal) data. Furthermore, data is exposed to contextual changes (i.e. domain-shift conditions) that can also deviate from the data that is known beforehand, but these deviations don’t necessarily correspond to anomalies. The challenge for the detectors is then to be sensitive enough to detect small anomalies (to prevent false negatives), while embracing domain shifts (to prevent false positives).

This year’s edition of the DCASE challenge included an UAD-S dataset and task with audio data for industrial predictive maintenance, and many teams from all over the world proposed a wide variety of approaches. Reacting to the difficulties generally encountered, we decided to take a closer look at the data distribution itself. Specifically, We computed Uniform Manifold Approximations and Projections (UMAPs) of three different representations: log-STFTs, log-mels and L3 embeddings.

UMAPs allow us to explore high-dimensional data and identify some of its structure. Particularly, we looked for two properties that we consider beneficial: Separability (SEP) and Discriminative Support (DSUP). The idea is that, if anomalies can be separated from normal sounds via a simple boundary (SEP), and the training data covers normal sounds but not anomalies (DSUP), then the problem can be solved by directly using the training data to find said simple boundary.

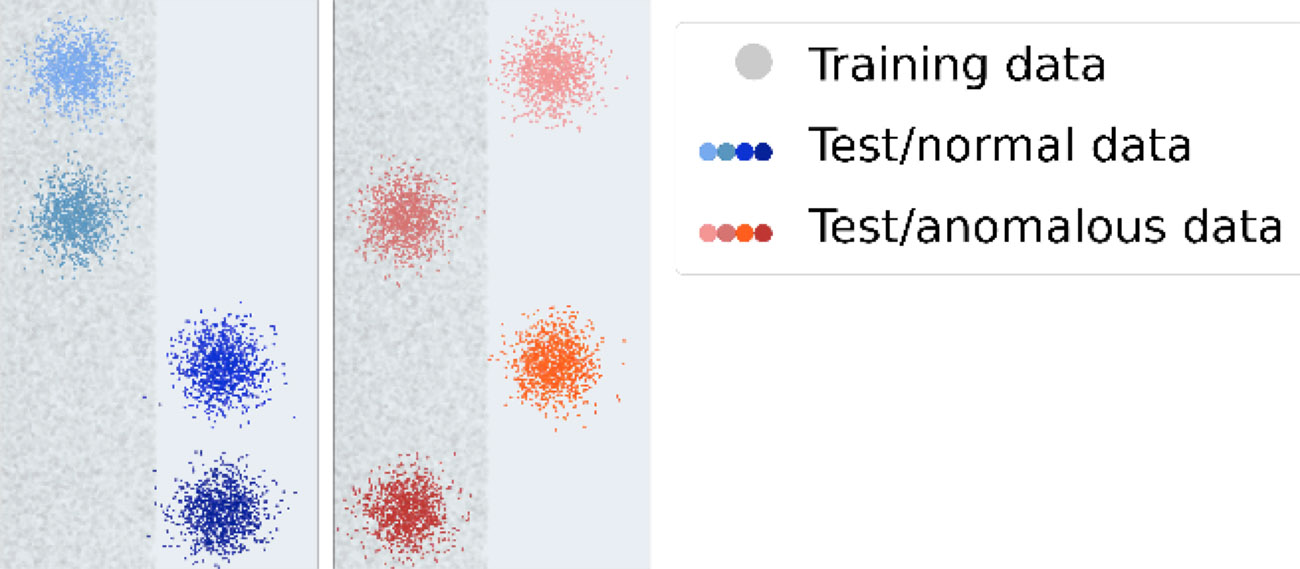
To enable visual inspection of SEP and DSUP, we rendered a series of dual scatter plots with anomalies on the right, and normal sounds on the left. Training data is shown identically on both sides in the form of semi-transparent, underlying “shadows”. The following image exemplifies the 4 different combinations of good/bad SEP and DSUP, one per row:

Only the row at the top presents good SEP and DSUP, because the anomalies and normal data don’t overlap, and the support provided by the training data can be used as boundary.

In total, we computed 72 UMAPs (ca. 1.1 GB) and rendered 198 plots (ca. 1GB) with different parametrizations and levels of detail. In the paper we provide further details about the methodology and experiments, as well as highlighted results and hypotheses, but due to space limitations there isn’t enough place to include everything. To overcome this limitation, at the top of this post we provide download links for all UMAPs and plots, as well as the code to compute them. We hope that this can help interested readers to review our hypotheses and elaborate further ones. To that end, the code is released under the MIT license and the images under CC-BY.


